The Dual Realities: Indexed State vs. Live State
One of the most confusing moments for developers occurs when a bug is fixed in production, but Search Console still reports an error.
The default view in URL Inspection shows Google’s Indexed Version—a snapshot of the page at the time of its last crawl. To see what Googlebot sees right now in real time, you must click “Test Live URL”.
What Happens During a Live Test?
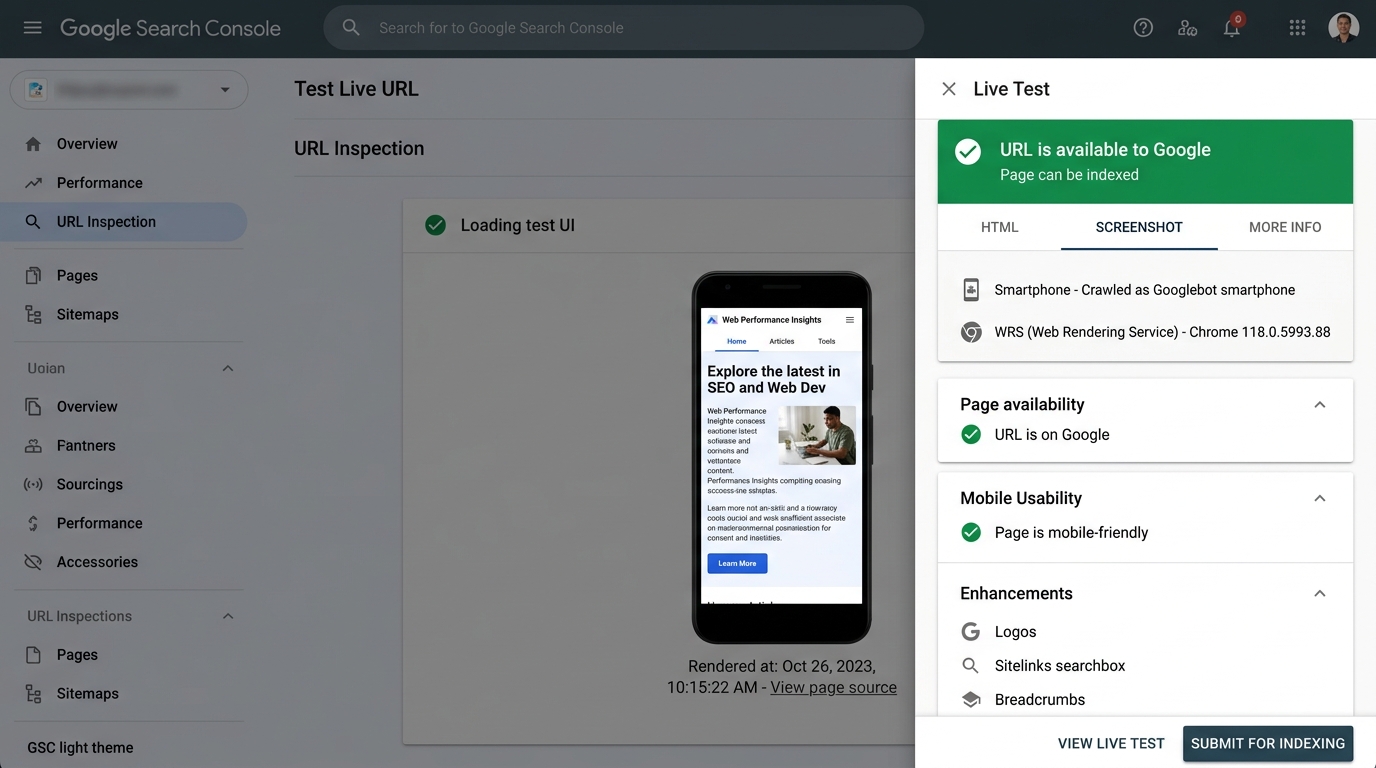 Figure 1.2: The Live Test drawer displaying the ‘Screenshot’ tab rendered by Googlebot’s Web Rendering Service (WRS), along with page availability, mobile usability, and structured data detection.
When you trigger “Test Live URL”:
- Googlebot establishes an immediate on-demand HTTP connection to your origin server.
- It downloads HTML, CSS, JavaScript, web fonts, and images.
- It spins up a headless Chromium instance in Google’s cloud and executes the JavaScript code.
- It performs layout rendering, computes CSS styles, and records console messages and network errors.
┌────────────────────────────────────────────────────────────────────────┐
│                        "VIEW TESTED PAGE" PANEL                        │
│                                                                        │
│  [ HTML Tab ]        [ Screenshot Tab ]       [ More Info Tab ]        │
│  The rendered DOM    Visual viewport as       HTTP response codes,     │
│  post-JavaScript     rendered by Chromium     failed page resources &  │
│  execution           mobile viewport          JavaScript exceptions    │
└────────────────────────────────────────────────────────────────────────┘
Deconstructing the Three Diagnostic Tabs
1. The HTML Tab (Rendered DOM vs. Server HTML)
Do not confuse this with curl or “View Source”. This tab displays the Rendered DOM after JavaScript frameworks (React, Vue, Angular, Astro client islands) have hydrated and mutated the document tree.
- Check whether your client-side JavaScript successfully injected
<meta name="description">,<h1>, or internal<a href="...">links. - If a client-side library fails silently, this tab will show a blank
<div id="root"></div>.
2. The Screenshot Tab (Visual Render)
Renders a visual capture from Googlebot Smartphone’s perspective (usually a 412x869 viewport).
- Look for accidental modal overlays, cookie consent banners blocking main text, or blank white screens caused by fatal runtime JS errors.
3. The More Info Tab: The Secret Debugger
This is the single most valuable tab for frontend engineers and technical SEOs:
- Page resources: Shows how many assets (CSS, JS, images, fonts) failed to load.
- Console messages: Captures
console.errorand unhandled exceptions that occurred during Googlebot’s render loop.
The Consequence:
In URL Inspection, the server returned 200 OK. But the Screenshot Tab showed a completely blank white page! The More Info Tab revealed that app.bundle.js was returning 403 Forbidden. Because the single-page app couldn’t load its bundle, Google saw zero text and demoted the site for thousands of keywords.
Common Live Test Errors & Solutions
| Error Message in Live Test | Root Cause | Engineering Solution |
|---|---|---|
| “Page resource could not be loaded: Blocked by robots.txt” | CSS/JS file is disallowed in robots.txt | Remove restrictive disallow rules for themes/assets |
| “Page resource could not be loaded: Other error” | Timeout, CDN rate-limiting, or HTTP/2 RST_STREAM | Optimize CDN latency; whitelist Googlebot IP ranges |
| “JavaScript Exception: ReferenceError: window is not defined” | SSR code attempting to access browser globals | Guard browser-only APIs (if (typeof window !== 'undefined')) |