Communicating Technical Impact to Leadership
Technical SEO improvements (fixing Soft 404s, pruning crawl bloat, speeding up LCP) mean nothing to executive stakeholders unless translated into business outcomes: organic click volume, qualified lead demand, and market share.
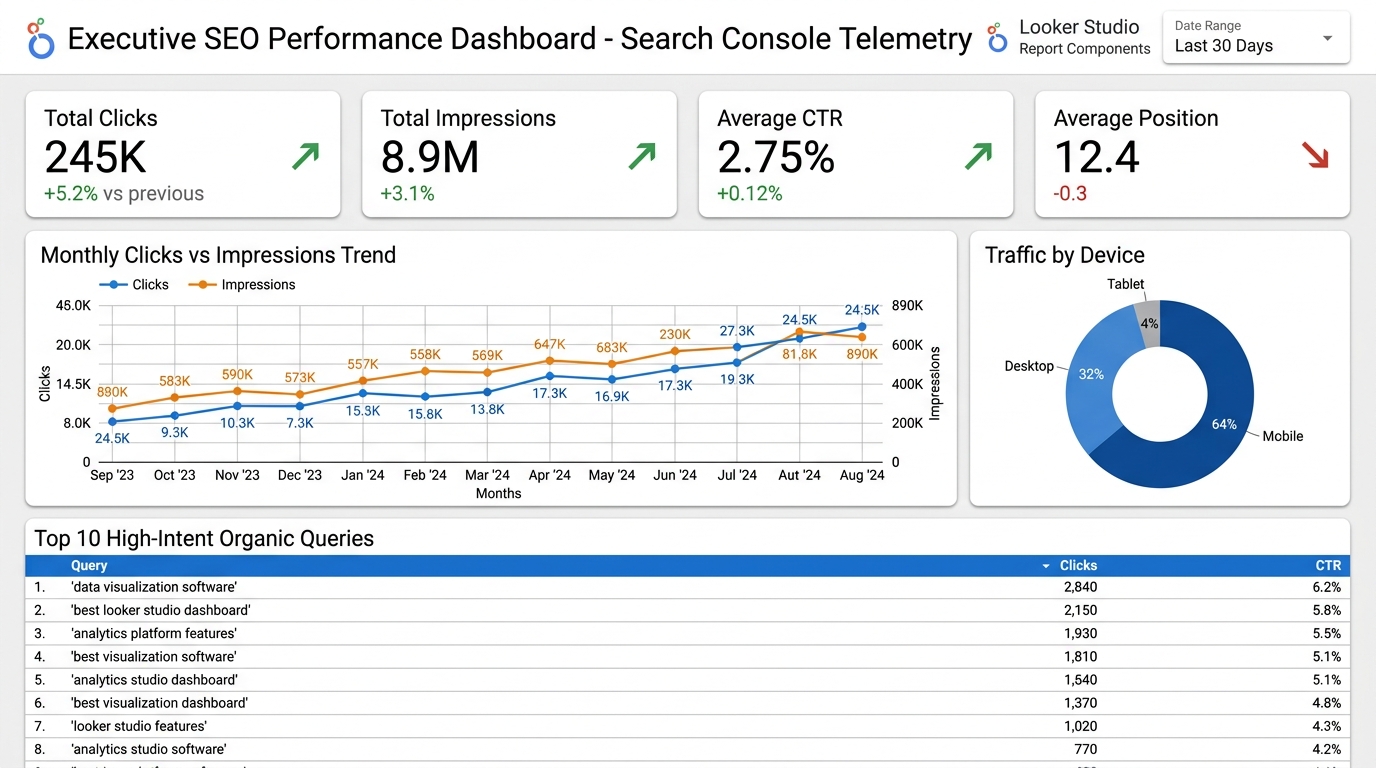 Figure 7.2: Executive Search Console dashboard in Looker Studio showing high-level KPIs (Total Clicks 245K, Impressions 8.9M, CTR 2.75%), monthly dual-axis trends, device breakdowns, and top intent queries.
Looker Studio (formerly Google Data Studio) allows engineering and marketing leaders to build live, automated, interactive executive reporting dashboards connected directly to Search Console.
Direct Connector vs. BigQuery Connector
When connecting Looker Studio to Search Console data, you have two integration architectural paths:
┌───────────────────────────────────────┬───────────────────────────────────────┐
│       DIRECT GSC CONNECTOR            │         BIGQUERY CONNECTOR            │
├───────────────────────────────────────┼───────────────────────────────────────┤
│ Connects straight to the GSC API      │ Queries your GCP BigQuery dataset     │
│                                       │                                       │
│ PROS:                                 │ PROS:                                 │
│ • Free and instant setup              │ • Zero row limits (millions of rows)  │
│ • Zero SQL code required              │ • Blends CRM, revenue & GA4 data      │
│                                       │ • Custom calculated fields & joins    │
│ CONS:                                 │                                       │
│ • Subject to API quotas               │ CONS:                                 │
│ • Limited to 16 months history        │ • Minor BigQuery query scanning costs │
│ • Slow dashboard load times on large  │ • Requires basic SQL query governance │
│   data sets                           │                                       │
└───────────────────────────────────────┴───────────────────────────────────────┘
The 4-Quadrant Executive Dashboard Blueprint
A world-class executive dashboard should fit on a single screen and answer four fundamental questions:
┌───────────────────────────────────┬───────────────────────────────────┐
│  QUADRANT 1: MACRO PERFORMANCE    │  QUADRANT 2: NON-BRAND MOMENTUM   │
│  • Total Organic Clicks (vs. LY)  │  • Pure Non-Brand Clicks & CTR    │
│  • Total Impressions (vs. LY)     │  • High-Intent Transactional      │
│  • Average Position Trend Line    │    Keyword Trajectory             │
├───────────────────────────────────┼───────────────────────────────────┤
│  QUADRANT 3: INDEXATION HEALTH    │  QUADRANT 4: TOP WINNING ASSETS   │
│  • Valid Indexed Pages Ratio      │  • Top 10 High-Growth Landing     │
│  • Critical 5xx / 4xx Error Count │    Pages by Delta Clicks          │
│  • Mobile CWV Passing Ratio (%)   │  • Striking Distance Conversion   │
└───────────────────────────────────┴───────────────────────────────────┘
Essential Calculated Fields for Looker Studio
Inside your Looker Studio data source, create these custom formulas:
1. Pure Non-Brand Segment
CASE
  WHEN REGEXP_MATCH(Query, '(?i).*(brand|brandname|productname).*') THEN "Brand"
  ELSE "Non-Brand"
END
2. Search Intent Classifier
CASE
  WHEN REGEXP_MATCH(Query, '(?i)^(how|what|why|where|when|can|guide|tutorial).*') THEN "Informational"
  WHEN REGEXP_MATCH(Query, '(?i).*(pricing|price|cost|vs|compare|best|review).*') THEN "Commercial"
  WHEN REGEXP_MATCH(Query, '(?i).*(buy|download|order|coupon|login).*') THEN "Transactional"
  ELSE "Navigational"
END
3. Click-Through Efficiency Ratio
SUM(Clicks) / SUM(Impressions)